What the ballot can and cannot say — expressiveness, measured¶
→ Companions: scores vs ranks · strict vs weak ranks · the fidelity ladder · scale granularity can flip the winner · the rates this corrects: Condorcet efficiency, measured · the worked election: ballot expressiveness · Level: 301 · deep dive
Condorcet efficiency, measured carries this caveat, and calls it the biggest one on the page:
Ballot resolution is not held constant across methods — ranked methods get full-resolution preferences, score methods get six rungs. Realistic (a 0–5 ballot genuinely cannot rank seven candidates), but it means part of the STAR-vs-RR gap at large fields measures ballot expressiveness rather than tabulation rule.
That is a real problem with the measurement, and stating it is not the same as fixing it. This page fixes it — by counting what each ballot can actually record, and then by re-running the simulation with the ballot and the rule varied independently, so "what the paper could not carry" and "what the count got wrong" stop being one number.
The short answer, in three parts. At seven or more candidates the caveat is not just correct, it is most of the gap: about 80% of STAR's shortfall against Ranked Robin on a single-issue spectrum is the six-rung ballot, not the automatic runoff — STAR's rule at full resolution scores 98–100%. Second, the direction people expect is wrong once you use a real ranked ballot: capped at five names, as New York City and Maine cap theirs, the ranked ballot is far less expressive than the 0–5 score ballot and loses answers the score ballot keeps. Third — and this is why the caveat does not rescue RCV-IRV — IRV barely notices ballot resolution at all, because it never reads the part of the ballot that resolution lives in.
1. Cardinal and ordinal are not more and less — they are different¶
A cardinal (score) ballot records order and intensity, at limited resolution. An ordinal (ranked) ballot records order alone, at full resolution. Neither contains the other. Each throws away exactly what the other keeps:
- A ranked ballot cannot say "my first choice is barely ahead of my second, and both are miles ahead of the rest." Every gap is one step.
- A 0–5 ballot cannot say "these nine candidates are in this strict order," because six rungs hold six distinct places.
The second limit is a pigeonhole, not a tendency: from seven candidates onward every voter must give at least two candidates the same score, whatever they think. Here it is happening to one real voter — the one standing at +0.20 in the worked election, who holds nine distinct opinions and gets to write down six:
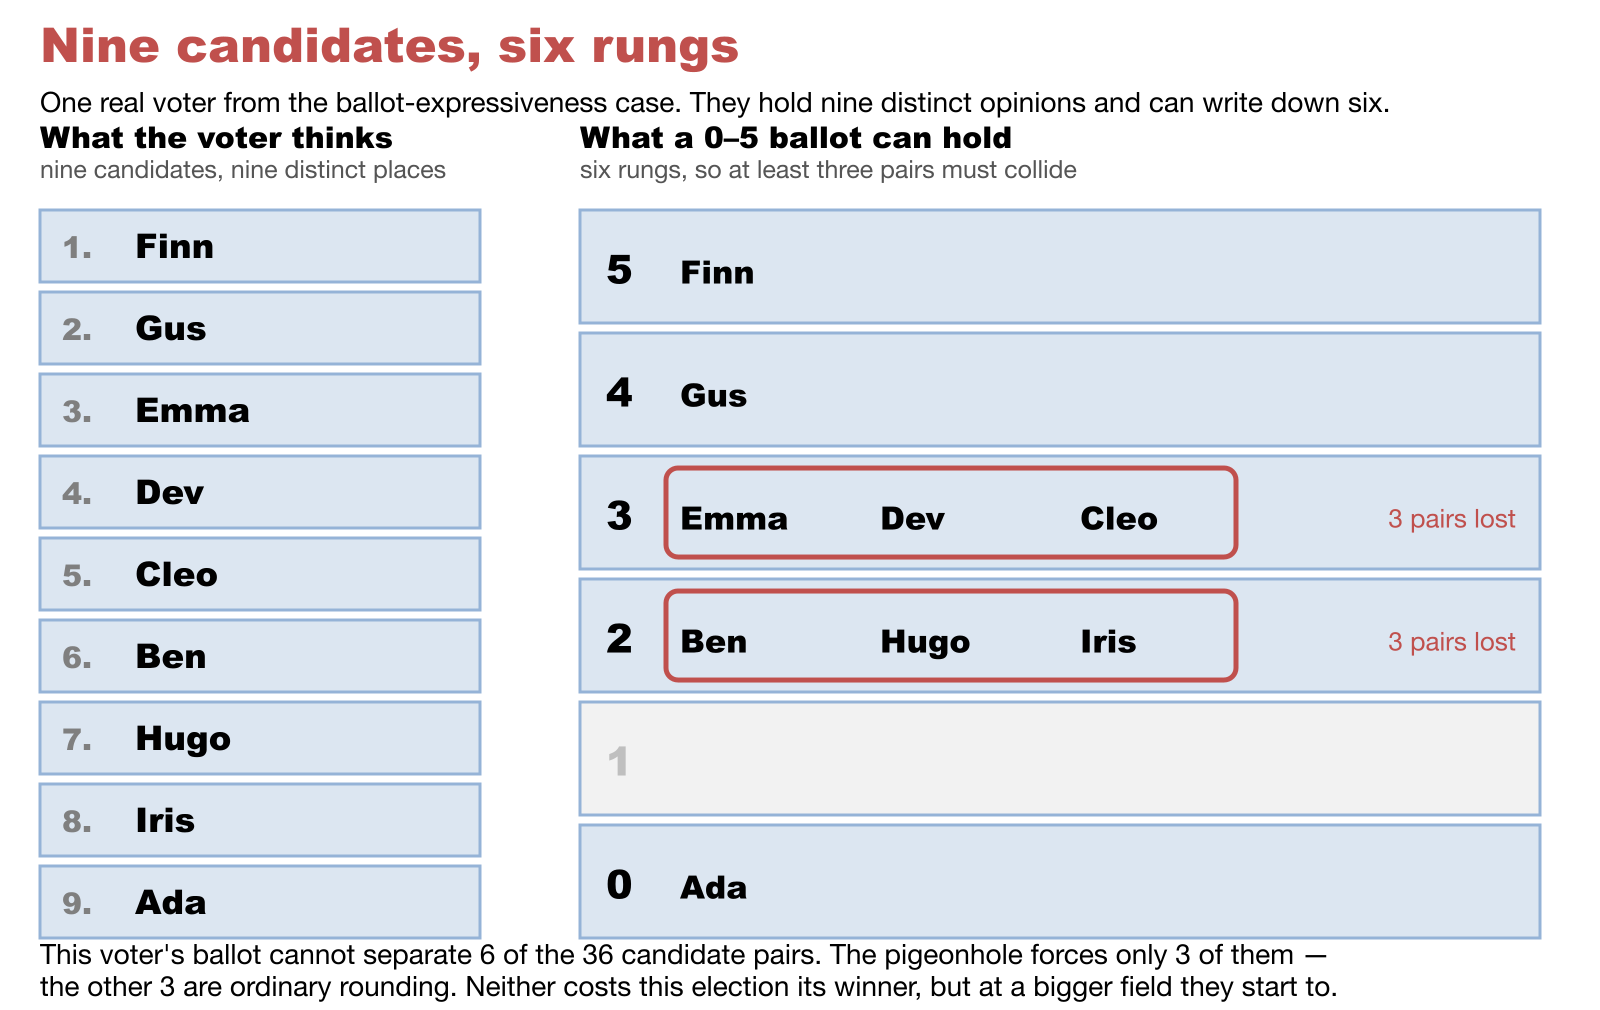
Six of that voter's 36 pairwise opinions do not make it onto the paper. Note the second line of the caption, because it is the part usually skipped: the pigeonhole forces only three of those six. The other three are ordinary rounding, and rounding is doing at least as much work as the hard limit. The first thing worth doing, then, is counting properly.
2. Count what each paper can record¶
Pure arithmetic — no sampling, no model, nothing to disagree with:
uv run 06_Other/simulations/condorcet_efficiency_simulation.py --ballot-counts --candidates 3 5 7 9 11 13 14
  C |         strict rank          0-5 ballot       0-5 as orders               weak rank    top-5 rank | strict rankable?
--------------------------------------------------------------------------------------------------------------------------
  3 |                   6                 216                  13                      13            16 | all
  5 |                 120               7,776                 541                     541           326 | all
  7 |               5,040             279,936              42,253                  47,293         3,620 | NONE
  9 |             362,880          10,077,696           2,944,381               7,087,261        18,730 | NONE
 11 |          39,916,800         362,797,056         162,509,293           1,622,632,573        64,472 | NONE
 13 |       6,227,020,800      13,060,694,016       7,674,723,421         526,858,348,381       173,486 | NONE
 14 |      87,178,291,200      78,364,164,096      50,737,344,843      10,641,342,970,443       266,645 | NONE
0-5 as orders collapses together the score ballots that say the same thing about order — so it is the fair like-for-like against a ranking. weak rank is the ranked ballot that permits equal ranks, which is what Ranked Robin actually accepts.
Three things fall out, and the first two are the opposite of the folk claim:
A 0–5 ballot records more distinct opinions than a strict ranking, all the way up to fourteen candidates. At seven candidates it is 279,936 against 5,040 — fifty-five times as many. The crossover where the ranking finally overtakes it is C = 14.
Past six candidates the two ballots express disjoint sets of orderings. Every strict ranking of seven candidates uses seven distinct places; a 0–5 ballot has six. So the score ballot expresses 42,253 orderings, the strict ballot expresses 5,040, and not one is in both sets. Neither is a subset of the other, which is why "more expressive" is the wrong axis. Only the weak-ranked ballot (47,293) is a superset of both.
The real ranked ballot is by far the smallest. No large-field jurisdiction issues a full-resolution ranking: NYC and Maine cap at five, San Francisco used three for years. At nine candidates that cap records 18,730 opinions against the score ballot's 10,077,696 — three orders of magnitude fewer, because it says nothing whatever about four of the nine candidates.
3. The yardstick is the reason the caveat exists¶
Here is the part that explains why the confound is there at all, and it is not an accident of the harness.
Condorcet efficiency grades on order. The Condorcet winner is defined entirely by pairwise order, so a ballot that records order completely is being graded on exactly what it records, and a ballot that spends half its capacity on intensity is not. The order-complete ballot wins by construction. A yardstick built on intensity instead — utility efficiency, VSE — would tilt the other way just as structurally, and for the same reason.
So the caveat is really this: Condorcet efficiency is not a neutral referee between cardinal and ordinal ballots. It is a fair referee between rules, which is what the next section measures, and a loaded one between papers. That does not make the numbers wrong — a real STAR election really is counted on six rungs, so the cost really does land on STAR — but it does mean the comparison must be read as "how often does this method find the order winner", never as "which ballot is better".
4. The controlled experiment: vary the ballot, hold the rule¶
Cross the papers with the rules and the confound comes apart. Copeland on the 0–5 ballot isolates the paper (same rule, coarser ink). STAR's rule at full resolution isolates the count (same paper as the control, different rule).
uv run 06_Other/simulations/condorcet_efficiency_simulation.py --expressiveness --trials 4000 --voters 501 --candidates 3 5 7 9 11
model       C    V |  RR full   RR 0-5  RR top5  RR top3 | STAR full  STAR 0-5 | IRV full  IRV 0-5  IRV top5  IRV top3 |  tied% forced%
---------------------------------------------------------------------------------------------------------------------------------------
noise       3  501 |   100.0%    88.6%   100.0%   100.0% |     96.2%     88.8% |    95.9%    82.8%     95.9%     95.9% |   6.7%    0.0%
noise       5  501 |   100.0%    83.2%   100.0%    85.8% |     94.6%     83.8% |    90.2%    71.3%     90.2%     81.0% |  11.4%    0.0%
noise       7  501 |   100.0%    81.9%    90.4%    73.3% |     93.1%     81.1% |    84.4%    64.7%     79.1%     68.2% |  13.3%    4.8%
noise       9  501 |   100.0%    81.5%    81.0%    64.1% |     94.3%     81.9% |    82.0%    62.6%     71.3%     61.5% |  14.4%    8.3%
noise      11  501 |   100.0%    81.8%    74.0%    55.2% |     94.3%     79.7% |    76.9%    60.2%     65.1%     52.3% |  15.1%    9.1%

spatial1d   3  501 |   100.0%    97.3%   100.0%   100.0% |    100.0%     97.2% |    87.6%    86.1%     87.6%     87.6% |   6.2%    0.0%
spatial1d   5  501 |   100.0%    90.6%   100.0%    86.5% |     99.6%     86.3% |    60.1%    59.1%     60.1%     56.9% |  11.3%    0.0%
spatial1d   7  501 |   100.0%    83.4%    96.4%    37.1% |     99.4%     79.5% |    45.5%    45.8%     44.8%     34.1% |  13.9%    4.8%
spatial1d   9  501 |   100.0%    77.2%    65.7%    17.9% |     98.9%     72.3% |    35.7%    33.8%     32.5%     23.0% |  15.5%    8.3%
spatial1d  11  501 |   100.0%    71.8%    25.0%    14.0% |     98.8%     68.2% |    30.8%    29.5%     24.1%     18.1% |  16.8%    9.1%

spatial2d   3  501 |   100.0%    98.4%   100.0%   100.0% |    100.0%     98.4% |    96.8%    95.5%     96.8%     96.8% |   5.9%    0.0%
spatial2d   5  501 |   100.0%    96.2%   100.0%    97.2% |    100.0%     95.4% |    85.2%    84.1%     85.2%     83.8% |  10.9%    0.0%
spatial2d   7  501 |   100.0%    93.7%    99.5%    80.6% |     99.7%     92.3% |    71.0%    72.7%     70.9%     64.8% |  13.5%    4.8%
spatial2d   9  501 |   100.0%    92.8%    94.8%    63.7% |     99.7%     91.4% |    60.2%    63.5%     59.2%     50.6% |  15.1%    8.3%
spatial2d  11  501 |   100.0%    91.0%    83.6%    47.8% |     99.8%     89.7% |    49.4%    55.0%     47.0%     38.2% |  16.3%    9.1%

faction2d   3  501 |   100.0%    98.9%   100.0%   100.0% |     99.3%     98.8% |    95.3%    94.7%     95.3%     95.3% |   5.9%    0.0%
faction2d   5  501 |   100.0%    96.8%   100.0%    96.6% |     98.4%     94.9% |    84.3%    83.8%     84.3%     83.9% |  10.8%    0.0%
faction2d   7  501 |   100.0%    94.7%    98.9%    86.5% |     97.6%     91.9% |    76.2%    76.1%     76.1%     74.2% |  13.4%    4.8%
faction2d   9  501 |   100.0%    93.4%    93.2%    73.8% |     97.3%     89.4% |    70.6%    70.4%     70.1%     66.4% |  15.1%    8.3%
faction2d  11  501 |   100.0%    91.1%    82.5%    65.2% |     97.2%     87.7% |    64.5%    64.8%     63.0%     59.4% |  16.4%    9.1%
RR full is the control and must read 100.0%; tied% is the share of candidate pairs an average 0–5 ballot cannot separate, and forced% is the pigeonhole floor for comparison.
The decomposition¶
Take spatial1d at seven candidates, the cell the original caveat is really about. STAR measures 79.5% against the control's 100%, a gap of 20.5 points. Split it:
| The ballot — Copeland's own score, run on a 0–5 ballot instead of a ranking | −16.6 pts |
| The rule — STAR's rule, run on the full-resolution ballot the control gets | −0.6 pts |
| interaction (the two together are slightly worse than the sum) | −3.3 pts |
| observed STAR gap at 0–5 | −20.5 pts |
About 80% of the gap is the paper. At eleven candidates it is 89% (28.2 of 31.8). And the number that carries the point on its own: STAR's rule, given a fine enough ballot, is 98–100% Condorcet-efficient in every structured model. Score-then-automatic-runoff is very nearly a Condorcet method; what costs it the remaining few points at a big field is six rungs, not the runoff.
Read that in both directions, as the source page insists. It is not a defence that clears STAR — a real STAR election really is counted on a 0–5 ballot, so the loss is real and it lands on STAR. But it is not a property of the automatic runoff, it is inherited by every score-ballot method, and anyone attributing it to the top-two rule is attributing it to the wrong half of the method.
And the reversal, once the ranked ballot is realistic¶
Look along the RR block at spatial1d, eleven candidates. Same Copeland rule throughout — only the paper changes:
Ranked Robin (Copeland), spatial1d, 11 candidates, 501 voters
                                        Condorcet efficiency
ranks all eleven   ████████████████████  100.0%   an idealization; no jurisdiction issues this
0–5 score ballot   ██████████████······   71.8%   six rungs, but says something about everyone
ranks five         █████···············   25.0%   NYC, Maine
ranks three        ███·················   14.0%   San Francisco, historically
The 0–5 ballot beats the real capped ranked ballot by 47 points. Six rungs say something about every candidate; five ranks out of eleven say nothing about six of them, and a candidate nobody's ballot mentions wins no head-to-head. So the caveat, applied to ballots that actually exist rather than to the idealized one in the harness, points the other way at large fields — and the crossover is not exotic. It has already happened by seven candidates under a top-3 cap (96.4% → 37.1%).
5. RCV-IRV: the cross-reference that changes the story¶
IRV deserves its own reading here, because the caveat is usually deployed as though any ranked method benefits from it. Two findings, and they pull in opposite directions from what you would guess.
IRV gets the most expressive paper in the table and still finishes last. At spatial1d with seven candidates, IRV reading a complete nine-name ranking scores 45.5% — while STAR, reading six rungs, scores 79.5%. Handed the ballot the caveat says is richer, instant runoff elects the head-to-head winner less than half the time. Whatever the expressiveness gap is doing, it is not what separates STAR from IRV; center squeeze is.
IRV barely notices resolution at all. Compare IRV full with IRV 0-5 down any structured block — 45.5 vs 45.8 at spatial1d/7, 76.2 vs 76.1 at faction2d/7, 71.0 vs 72.7 at spatial2d/7. Essentially no difference, and occasionally better on the coarse ballot. The reason is mechanical and already documented here: IRV only ever counts each ballot's top surviving choice, discarding the down-ballot detail until a higher choice is eliminated. Resolution lives in exactly the detail IRV throws away, so a finer ballot buys it almost nothing — and a coarser one costs it almost nothing.
Put those together and the fair statement is sharper than either camp usually makes it. The ballot-expressiveness confound is a genuine confound for STAR and Ranked Robin, and essentially not one for RCV-IRV. Correcting for it moves STAR up to 98–100% and moves IRV nowhere.
The symmetric caution, stated in the same breath (house rule): under impartial noise IRV does beat STAR at every field size, on any paper — and the IRV 0-5 column there is the one genuinely hostile number in the table, because forcing a tie-laden score ballot into strict ranks means inventing preferences the voter does not hold. That column falls to 60.2% at eleven candidates. It is a real effect and it is exactly what the LH engine warns about when it converts scores to ranks, but it is a fact about score→rank conversion, not about IRV's own ballot.
6. Watch it happen: one electorate, five papers¶
Rates over thousands of elections are evidence; a single election you can read is understanding. Ballot expressiveness — one electorate, five papers freezes 25 voters and 9 candidates on one spectrum, where Finn beats all eight rivals head-to-head, and changes only what the voter may write down.
| Ballot | Count | Winner | |
|---|---|---|---|
| 0–5 scores | STAR | Finn | ✅ |
| ranks all nine | Ranked Robin | Finn | ✅ the control |
| ranks only five | Ranked Robin | Gus | ❌ the paper changed |
| ranks all nine | RCV-IRV | Ben | ❌ the count changed |
| ranks only five | RCV-IRV | Ben | ❌ unchanged — already lost |
Rows 2 and 3 differ only in the paper; rows 2 and 4 differ only in the count. That is the whole distinction this page is about, in one election. On the capped paper Finn's record falls from 8–0 to 5–1–2t — not because anyone changed their mind, but because only 16 of the 25 voters can fit Finn into five names.
Every ballot is derived from frozen positions by a stated rule, and no count in that folder is settled by a tie-break — that was a search constraint, after an earlier candidate electorate was discarded for having an 8–8 IRV elimination tie whose winner flipped between lot rules.
Four of the five papers are live, so you can fill them in yourself: BetterVoting election 37yf8x (results ↗), one race each. It is worth voting rather than only reading, because two of the limits on this page are things you feel rather than follow: on the STAR race, nine candidates and six rungs means you physically cannot give every candidate a different score; and the third race sets max_rankings: 5, so BetterVoting enforces the real NYC/Maine cap and you run out of places to put Finn. BV tabulates all four independently and agrees with the LH engine on every winner, reporting tieBreakType: none throughout.
7. Caveats¶
- The unstated pairs on a truncated ballot are a convention. Here an unranked candidate is beaten by everyone the voter ranked and tied with everyone else left off; other treatments split that pair half-and-half. The
top-kcolumns move if you change it, and the choice belongs with any quotation of them. - The rank caps are real but not universal. Five is NYC and Maine; three was San Francisco; some jurisdictions do allow a full ranking. The point is not that every ranked election is capped, it is that the idealized uncapped ballot in the harness is the unusual one at a large field.
- Min-max normalization is doing work. Voters here scale their own utilities onto 0–5 and round. Real voters do not normalize perfectly, and this rule is what sets the
tied%column — the most consequential modelling assumption on both this page and its parent. forced%is a floor, not the effect. The pigeonhole compels ties only from seven candidates, and only 4.8% of pairs there — while voters actually tie 13.9%. Most flattening is ordinary rounding. Do not blame the pigeonhole for work that rounding did.- Condorcet efficiency is the only yardstick used here, and §3 explains why that is not neutral between cardinal and ordinal ballots. A utility-based measure would rank these papers differently. Neither measure is the truth.
- Four models is not the world, and every number above is sincere-ballot only.
Where this lands¶
The caveat on Condorcet efficiency, measured was right, and understated: at large fields the ballot is most of the STAR-vs-RR gap, and STAR's rule at full resolution is very nearly Condorcet-efficient. But the fix does not hand the argument to ranked ballots, for two reasons this page measures rather than asserts — real ranked ballots are capped, which costs far more than six rungs do, and RCV-IRV cannot spend the expressiveness it is given, because it never reads the part of the ballot that holds it.
The design lesson is the one the counting table already implies: the question is not which ballot is more expressive, it is which dimension you want expressed. Order, or intensity. Cardinal and ordinal each answer one of those completely and the other not at all, and what makes a good winner is where this repo argues about which one an election should be asking for.
See also: scores vs ranks · strict vs weak ranks · the fidelity ladder · scale granularity can flip the winner · the worked election · Condorcet efficiency, measured · why more candidates make every method miss · the crowded field · exhausted ballots · simulations folder