Simulations — measure it, don't guess it
This folder holds brute-force simulations that measure a claim instead of citing a number we can't defend. Two rules — each a 301-level lesson in its own right: always report the model and parameters with any number, and never let an arbitrary tiebreaker silently inflate a result. A third, more foundational one — sample voter utilities and derive each ballot from them; never draw random ballots — is why every script here starts from sample_utilities(): Simulate utilities, not ballots.
Thinking about a harness rather than another script? Goals, requirements, and the existing landscape surveys the fifteen simulators other people have already written — including the one in Julia that covers all six of this library's methods — derives the requirements from what they assume, and measures whether Rust would help (2.9× for sampling, 238× for exhaustive search).
- The six Euclidean spaces —
euclidean_spaces.py: not a measurement but the reference for everything else here — whatuniform_ball,gaussian_cube,unbounded_gaussianand the rest actually draw, implemented from their definitions, cross-checked againstprefsampling, and plotted (jump to section). Concept page: The six Euclidean spaces. - Statistical cultures —
statistical_cultures.py: the other reference script — whatimpartial,urn alpha=0.1,norm-Mallows phi=0.5and the structured domains actually produce, measured, with fourteen anchors checked against values known in advance (jump to section). Concept page: Statistical cultures. - What the distance→score rule costs —
score_encoding_stability.py: a spatial model hands you a distance, not a ballot, and the rule that converts one to the other is an unstated modelling choice. Measures how much it moves the STAR winner — 6.8% to 27.2% depending on the space (jump to section). Writeup: Simulate utilities, not ballots. - How many rungs does a score ballot need? —
score_resolution.py: the other half of that same seam. Holds the normalization fixed and varies the resolution — 0/1, 0–2, 0–3, 0–5, 0–9, 0–99, and a voter with infinite precision (jump to section). Welfare saturates by three or four rungs; the cut placement turns out to matter more than the rung count at low resolution. Writeup: Continuous model, discrete ballot. - Flat vs Zipf-weighted axes —
dimension_weighting.py: does a many-equal-axes electorate really make every method agree, and does Zipf weighting fix it? (jump to section). Direction confirmed, magnitude overstated, and the mechanism usually given for it is measurably wrong. Writeup: The spatial model. - Favorite-Betrayal (FBC) —
fbc_simulation.py(below). - Runoff Reversal frequency —
runoff_reversal_simulation.py(jump to section). - STAR vs Approval divergence —
star_vs_approval_divergence.py: how often sincere STAR and Approval elect different winners (spoiler: no single number — it depends on the electorate model and the approval cutoff). Full writeup + measured rates + worked examples: How often do STAR and Approval disagree?. - Condorcet efficiency —
condorcet_efficiency_simulation.py: how often does each of six methods elect the Condorcet winner? (jump to section). Full writeup + the table: Condorcet efficiency, measured. Its--chartand--whymodes back a second page: Why more candidates make every method miss, which explains the field-size effect and works it through one 65-voter election at 3, 5 and 7 candidates. Its--expressivenessand--ballot-countsmodes back a third: What the ballot can and cannot say, which separates ballot resolution from tabulation rule and works it through one 25-voter election on five different papers. - Strategic preservation of the sincere winner —
strategic_cw_preservation.py: the same question as above, but with voters allowed to lie (jump to section). Separates the sincere baseline, successful attacks and backfired attacks, which a single "does the sincere Condorcet winner still win" rate merges. Full writeup + the tables: Formal compliance vs. strategic preservation. - Does the qualifying round throw away the consensus winner? —
primary_method_simulation.py: in a two-stage reform (open primary → top N → good general), how often does the primary discard the consensus candidate? Full writeup + measured rates: Does the qualifying round throw away the consensus winner? (mechanics).
The six Euclidean spaces
euclidean_spaces.py is the odd one out in this folder: it measures no voting claim. It answers the question every other script here quietly assumes an answer to — where do the voters' points come from?
Every spatial run below scatters voters and candidates and lets each voter prefer whoever is nearest. The scatter has a named shape, and the names (uniform_ball, uniform_sphere, uniform_cube, gaussian_ball, gaussian_cube, unbounded_gaussian) travel through this repo's results without ever being defined. This script defines them by implementing each one in a few lines from its own description, then checking that implementation against prefsampling's — so the explanation is verified rather than asserted.
python euclidean_spaces.py             # the stats table + cross-check
python euclidean_spaces.py --gallery   # also draw img/euclidean_spaces.png
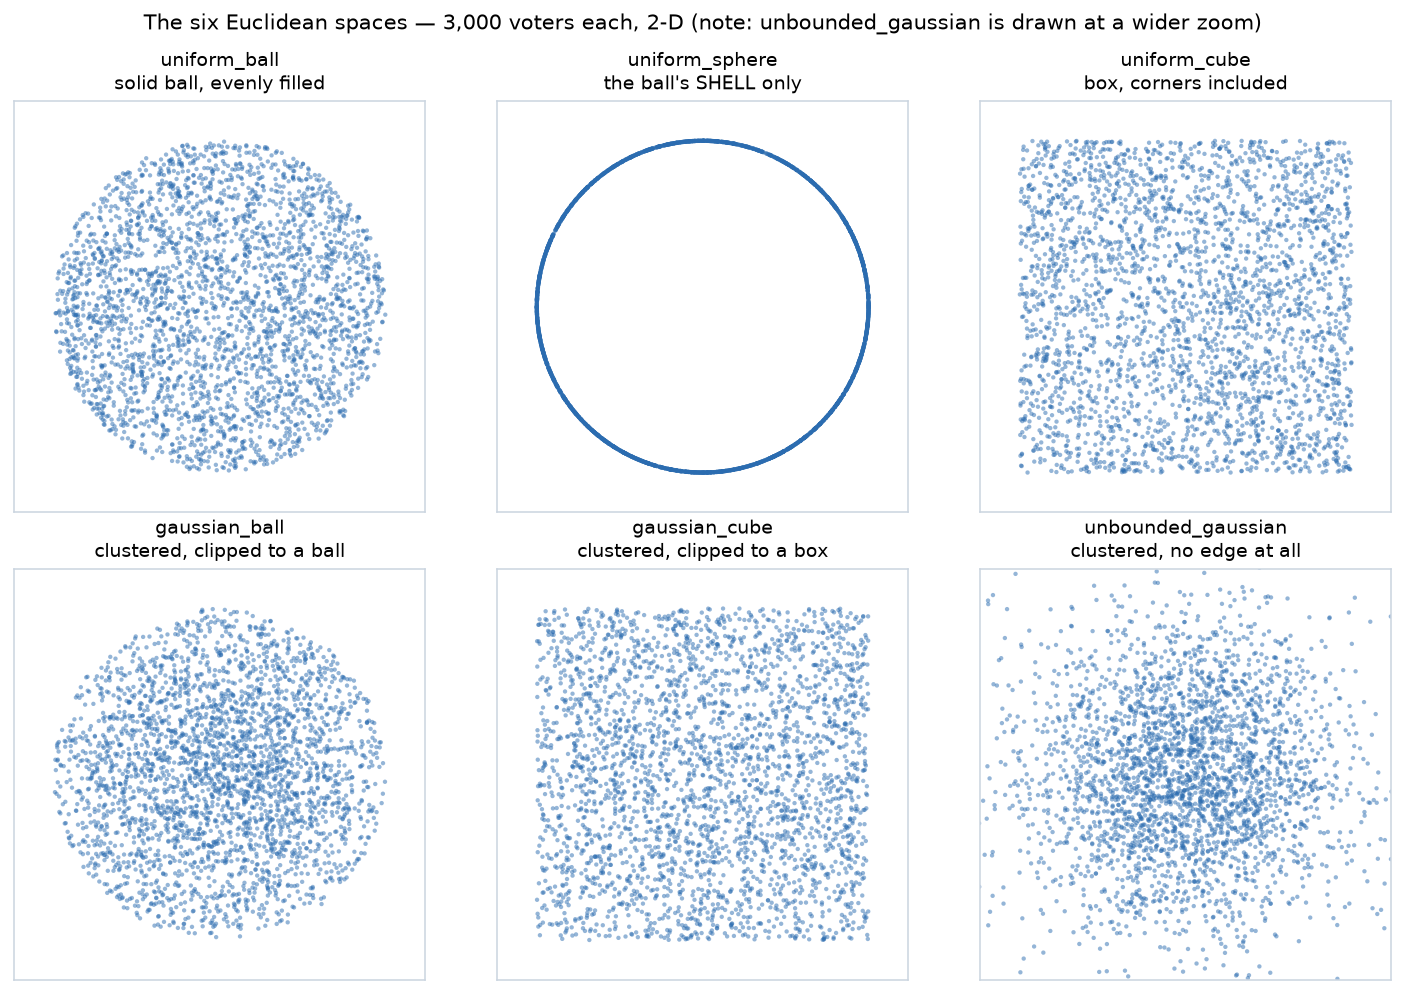
Two findings worth knowing before picking a model:
gaussian_cubeis barely clustered at all at the library's default parameters — 21% of points inside the inner half-radius againstuniform_cube's 20% — because aNormal(0, 1)truncated to ±0.5 is nearly flat over that interval. It discards 85% of its draws to achieve that.gaussian_ball(36%) is the one that actually clusters.- Seeding these samplers breaks them, in
prefsampling0.1.24. That is why this script cross-checks unseeded and draws its own points. Filed as prefsampling#6 and pref_voting#186; short version on the concept page, full mechanism in the companion QA repo.
Statistical cultures
statistical_cultures.py is the second reference script, and the non-spatial half of the same job. Where euclidean_spaces.py answers "where do the voters' points come from?", this one answers "what if there are no points at all?" — the named distributions over whole preference profiles that the literature quotes as impartial culture, urn alpha=0.1, norm-Mallows phi=0.5, always with a parameter and rarely with an explanation.
python statistical_cultures.py             # the dial table
python statistical_cultures.py --verify    # 14 anchors known before the run
python statistical_cultures.py --normalise # why raw Mallows phi drifts as m grows
python statistical_cultures.py --peaks     # Conitzer and Walsh are not the same
Two findings, both from the main table:
- Impartial Culture is a knife-edge. Moving from IC to norm-Mallows φ = 0.75 drops mean ballot disagreement by 7% — invisible to the eye — and drops the no-Condorcet-winner rate from 16.65% to 0.80%. The famous IC paradox rates describe one exact point, not "electorates where voters disagree a lot."
- Disagreement does not cause cycles; structure does.
group_separablescores 0.500 on disagreement, identical to IC, and yet produces a Condorcet winner every time against IC's 16.65% failure rate. The single-peaked and single-crossing domains are 0.00% too — which is why a sweep confined to structured domains will conclude that cycle-resolution rules are interchangeable.
The verification is worth a note of its own: the obvious IAC check — does urn(alpha=1/m!) match impartial_anonymous? — is vacuous, because prefsampling implements the latter as the former, so it compares a function with itself. The script checks the definition instead, enumerating all 56 anonymous profiles for 3 voters and 3 candidates and confirming the urn spreads uniformly over them. Full writeup: Statistical cultures.
What the distance→score rule costs
score_encoding_stability.py picks up where euclidean_spaces.py stops. That script says where the points come from; this one asks what happens after — because a spatial model produces a distance, and STAR needs an integer 0–5. The line of code that bridges them is the least-discussed step in the whole pipeline, and it is not neutral.
Two rules are in circulation. A global d_max (U = 5 × (1 − d / d_max), one denominator for everyone) treats the scale as absolute. Per-voter min-max gives your nearest candidate 5 and your furthest 0 — what every other script here uses, and what STAR's voter guidance describes.
python score_encoding_stability.py                  # uniform_cube, all three encodings
python score_encoding_stability.py --all-spaces     # every one of the six
python score_encoding_stability.py --banker         # numpy's round-half-to-even
Three findings:
- The winner moves. From identical positions, the two rules elect different candidates 6.8%–10.3% of the time across five of the six spaces, and 27.2% on
uniform_sphere— an electorate of pure factions, where more than one election in four turns on the conversion arithmetic alone. - A global
d_maxerases voters. It has to span the furthest possible pair, so a typical ballot compresses into the middle of the scale: 81% of marks land in {2,3,4}, and 2.5% of voters score every candidate identically — expressing nothing. Min-max cannot do this (0.00%). It also inflates Equal Support in the runoff about threefold. Note too thatunbounded_gaussianhas no maximum distance at all, so a globald_maxthere is undefined and any implementation is silently substituting the observed maximum. - Banker's rounding is a red herring here.
numpy.roundtips half-integers toward even, but--bankerand half-up produce identical distributions and winners: sampled float distances essentially never land on a boundary. It bites hand-built worked examples with round coordinates, not simulations — a documentation hazard, not a modelling one.
How many rungs does a score ballot need?
score_resolution.py is the sibling of the script above, turning the other knob. That one fixes the ballot at 0–5 and asks which normalization rule to use; this one fixes the normalization at per-voter min-max and asks how many rungs the ballot needs. The baseline is a voter with infinite precision — real-valued scores, no rounding — and every other row is the same rule quantized.
python score_resolution.py                       # the ladder, 4 candidates
python score_resolution.py --sweep-candidates    # the ladder across field sizes
python score_resolution.py --candidates 16 --equal-bands
Three findings:
- Welfare saturates at three or four rungs. One bit (approval) costs real welfare — VSE 0.9743, the only row that does. From 0–3 upward, 0–3, 0–5, 0–9, 0–99 and infinite resolution are indistinguishable (spread 0.002, seed noise). More rungs keep changing who wins — 0–5 misses the infinite-precision winner 3.8% of the time and 0–99 0.5% of the time — while not improving how good the winner is: they are re-sorting near-ties. A changed winner is not by itself evidence of a defect.
- The pressure is the field size, not the rung count. 0–5 differs from infinite precision 2.7% of the time on three candidates and 17.6% on sixteen. Six rungs sit comfortably past the knee for the field sizes single-winner elections actually have, which is the practical defence of the STAR ballot's scale.
- Where the cuts fall is a second choice, and at low resolution it dominates. Rounding to the nearest of K+1 rungs gives half-width end bands and full-width interior ones, so at K=2 the middle rung is a catch-all covering half the voter's range. On sixteen candidates that collapses a three-level ballot to VSE 0.9120 — worse than one bit. The same three levels cut into equal-width bands score 0.9746. This is Approval's cutoff problem reappearing inside a score encoder.
Flat vs Zipf-weighted axes
dimension_weighting.py checks a claim this repo repeats and the simulation literature repeats more loudly: that a spatial model with many equally weighted axes makes every method elect the same candidate, and that scaling later axes down by Zipf's law restores realistic disagreement.
python dimension_weighting.py                        # 100-D, 5 candidates
python dimension_weighting.py --dims 20 --candidates 8
The direction holds — four methods agree 85.3% of the time under flat axes and 41.8% under the strongest Zipf reading. Three corrections:
- "Every method agrees" overstates it. Flat 100-D still disagrees 14.7% of the time on a five-candidate field.
- The usual mechanism is wrong. It gets explained as the electorate becoming near-unanimous. Measured, voters are just as divided under both (mean pairwise rank correlation +0.272 vs +0.252). A flat model does not make voters agree, it makes methods agree. What moves is candidate separation: the utilitarian leader's lead over the runner-up falls from 27.7% of the field's spread to 16.3%, and methods split hairs on close races. Zipf does not abolish the centre either — a Condorcet winner still exists ~99.5% of the time in every model here.
- "Scale by Zipf" has two readings and the gap is most of the effect. Variance ∝ 1/k leaves an effective dimension of 16.5; sd ∝ 1/k leaves 2.5. Only the second matches the gloss everyone attaches to it. Say which one a number came from.
Favorite-Betrayal (FBC) simulation
fbc_simulation.py measures, by brute force over many random elections, how often STAR and RCV-IRV actually satisfy the Favorite Betrayal Criterion (FBC) — and how often a favorite-betrayal vote pays off vs backfires.
Why this exists
The debate doc once claimed STAR is "~98% favorite-betrayal-proof." That number had no defensible source: Equal Vote's criteria chart is binary pass/fail (STAR gets a ❌), and the ~91–98% figure that floats around is Voter Satisfaction Efficiency — an accuracy metric, a different thing entirely. Rather than cite a number we can't defend, this script measures one — and reports the modelling assumptions, because the result swings hugely with them.
What it measures
-
FBC-compliance frequency. For each random election, compute the sincere STAR (or IRV) winner
W. Then for every voter ask: holding everyone else sincere, is there any ballot in which they do not keep their true favorite (co-)top — a real betrayal — that elects someone they sincerely prefer toW? If even one voter has such a ballot, the election fails FBC. The betrayal search is exhaustive (every 0–5 ballot for STAR, every ranking for IRV), so this is a true best-response test, not a heuristic. -
Works : backfires ratio. Over every
(voter, betrayal ballot)pair, count how many strictly help the voter vs strictly hurt them (by sincere utilities). Reported per method. This is the brute-force cousin of Equal Vote's "honesty" stat — note it counts all possible betrayals, so it is a superset of the realistic strategies a real faction would attempt (read it as "if you betray blindly, how often does it pay?").
Electorate models (both run by default)
- spatial — voters & candidates are points in issue space; utility = −distance. The realistic model (what VSE / Bayesian Regret uses).
- impartial — each utility is uniform[0,1], independent. An adversarial stress test that manufactures far more paradoxes; treat its FBC rate as a rough lower bound.
Sincere ballots are derived deterministically: STAR scores = per-voter min-max scaling of utilities onto 0–5; IRV ranks candidates by utility. Tie-breaks are fixed and documented in the script header. Everything is seeded (--seed).
Running it
python3 fbc_simulation.py                 # default sweep, both models
python3 fbc_simulation.py --selftest      # known-answer checks only
python3 fbc_simulation.py --elections 3000 --voters 41 --candidates 3 --seed 7
--selftest confirms the tabulators are correct on known cases (clear STAR winner; a center-squeeze where IRV eliminates the center and STAR elects it).
Representative results
3 candidates, 2-D spatial / impartial, seeded. (FBC % = elections with no profitable favorite betrayal; ratio = help : hurt over all betrayal ballots.)
| model | voters | STAR FBC % | RCV-IRV FBC % | STAR works:backfires | IRV works:backfires |
|---|---|---|---|---|---|
| spatial | 15 | 91.9% | 95.5% | 0.02 : 1 | 0.07 : 1 |
| spatial | 41 | 96.2% | 97.2% | 0.02 : 1 | 0.13 : 1 |
| impartial | 15 | 79.4% | 89.6% | 0.04 : 1 | 0.08 : 1 |
| impartial | 41 | 80.8% | 90.8% | 0.04 : 1 | 0.09 : 1 |
What this means for the "98%" claim
-
"98%" is not reproducible as a distinctive STAR FBC property. Under the realistic spatial model STAR lands in the low-to-mid 90s%; under impartial culture, ~80%. It is never a clean "98%."
-
Both methods fail FBC at broadly similar low rates by this existence test — and, on raw existence, STAR is slightly worse than IRV, not better. The reason is mechanical: FBC is an existence criterion, and STAR's score ballot offers ~36× more betrayal ballots (216 vs a handful of rankings) — more lottery tickets to find one that helps, even though almost none do. So "STAR fails FBC less often than IRV" is not supported; the honest statement is "neither is favorite-betrayal-proof."
-
The real, robust difference is that betrayal reliably backfires in STAR. Across every run, a STAR favorite-betrayal is far more likely to hurt the voter than an IRV one (STAR ~0.02–0.04 : 1 vs IRV ~0.07–0.13 : 1 help : hurt). That is the measurable version of "honest voting is your safest bet in STAR" — and it's the claim to make, instead of a bare percentage.
(Magnitudes here are not directly comparable to Equal Vote's published ~1:1 STAR vs ~3:1 IRV, which uses a realistic strategic-faction model, not an exhaustive ballot search. Only the direction — STAR less rewardingly manipulable — is shared.)
Caveats (read before quoting)
- Small candidate field (default 3) — where center squeeze / favorite betrayal lives, but not the whole story.
- FBC tested for an individual pivotal voter, not a coordinated bloc; center squeeze in real polarized races is partly a bloc phenomenon.
- The works:backfires denominator includes every possible betrayal, so it understates how often a well-chosen strategy pays (and is not Quinn's VSE pipeline).
- Results are model-dependent. Always report the model and parameters with the number.
Runoff Reversal frequency simulation
runoff_reversal_simulation.py measures how often a Runoff Reversal happens — the Scoring-Round leader losing the Automatic Runoff (the phenomenon taught in Runoff Reversal).
Why this exists
A simulation once reported "16.9% divergence" under Impartial Culture with 5 candidates and 10 ballots. That number is reproducible — and, on its own, misleading. This script makes three hidden assumptions visible:
- The model is white noise. Impartial Culture makes every score independent and uniform, so
5,5,5,5,5is as likely as a realistic ballot. Real electorates are correlated, and correlation makes the score leader and the majority winner agree far more often — so the realistic reversal rate is much lower. - 10 ballots is mostly ties. At that size ~24% of elections have a tie for the top-two-by-score and ~14% have a tied runoff — nearly 40% are tie-ambiguous.
- An arbitrary tiebreaker inflated the count. The original picked the "score winner" by alphabetical order but broke STAR ties by reverse alphabetical order; when those two arbitrary rules disagreed it was logged as a "divergence." The genuine clean-reversal rate at that size is ~9–10%, not 17%.
What it measures
Each election lands in exactly one of four buckets, so ties are counted, not hidden: reversal (clean), runoff_tie, finalist_score_tie, no_reversal. Two electorate models run by default — impartial (white-noise stress test) and spatial (realistic, correlated). Everything is seeded; --selftest checks the classifier on hand-built reversal / no-reversal / tie cases.
Running it
python3 runoff_reversal_simulation.py --selftest
python3 runoff_reversal_simulation.py --elections 300000 --voters 21 --candidates 5
Representative results (5 candidates, seed 42)
| model | voters | clean reversal | runoff tie | finalist score tie | no reversal |
|---|---|---|---|---|---|
| impartial | 10 | 9.5% | 14.3% | 23.6% | 52.6% |
| spatial | 10 | 6.2% | 12.2% | 14.0% | 67.6% |
| impartial | 21 | 13.2% | 11.0% | 16.8% | 59.0% |
| spatial | 21 | 8.7% | 6.2% | 7.2% | 77.9% |
| impartial | 101 | 18.6% | 5.7% | 8.1% | 67.5% |
| spatial | 101 | 9.0% | 1.8% | 1.6% | 87.7% |
What this means
- There is no single "reversal rate." It depends on the model (impartial ≈ 2× spatial) and on electorate size (it rises as ties vanish with more voters).
- Report the model. Under the realistic spatial model with a real electorate (101 voters), clean Runoff Reversals are ~9% — not the ~17% the 10-ballot toy setup implied.
- It's still common enough to matter. Even on the conservative spatial model it's ~1 election in 11 — which is exactly why Runoff Reversal is worth teaching. The runoff isn't catching a rare freak case; it's a regular, deliberate correction.
Caveats (read before quoting)
- Sincere ballots only — no strategy.
- Spatial model is 2-D uniform; real issue spaces are lumpier (clusters, polarization).
- "Reversal" here is score-leader-vs-runoff only; it says nothing about the Condorcet winner (see Three notions of "winner").
- Always report the model, the size, and the tie split with the number.
STAR vs Ranked Robin divergence simulation
star_vs_rr_divergence.py — how often, and why, do STAR and Ranked Robin (Copeland / Condorcet) elect different single winners?
The mechanism
Same voter utilities feed both: STAR reads 0–5 scores (top-two by sum → pairwise runoff); RR reads the ranking (most head-to-head wins). A Condorcet winner who reaches STAR's runoff wins it (they beat any finalist head-to-head), so STAR ≠ RR requires either a Condorcet cycle, or the Condorcet winner missing the score-based top-two — a broadly-preferred but low-intensity compromise, everyone's tepid second choice. It is the preference-vs-support split made statistical: RR rewards order, STAR rewards how much support each candidate has.
Running it
uv run 06_Other/simulations/star_vs_rr_divergence.py --trials 3000
Two models of STAR — the fast one, and the authority
The sweep tabulates ~135,000 elections, so it uses star_winner(): numpy, top-two by score sum, pairwise runoff — including the engine's tie-break rungs (head-to-head wins among the tied, then five-star counts, then lot). It is not an approximation: it agrees with the engine on every profile tested, and tests/test_sim_star_model.py keeps it that way. The full 3000-trial sweep still runs in well under a minute.
star_winner_engine() is the real LH tabulation, and remains what you should use for anything written down — not because the fast model is wrong, but because the engine is right by construction rather than by agreement, so it cannot drift if the rungs ever change.
Until 2026-07-26 the fast model settled every tie by column order, and that gap is what mislabelled one of the 30 samples. You can still measure the gap — it should now read 0.0% everywhere:
uv run 06_Other/simulations/star_vs_rr_divergence.py --audit-model 400
About 1% of elections overall, but it climbs to ~5% at 10 candidates and 15 voters — precisely the corner the 30 divergence samples live in, and one of those 30 was in fact born mislabelled (cycle_C10_fewV29_bloc_2 claimed "STAR A"; the engine elects C). Their labels now come from the engine and are held there by tools_adam/scripts/check_star_vs_rr_labels.py + tests/test_star_vs_rr_labels.py.
Representative results (3000 trials/cell, seed 20260721)
| model | C | V | STAR≠RR | of which: cycle | of which: CW-missed-runoff |
|---|---|---|---|---|---|
| noise | 3 | 51 | 14.7% | 8.5% | 1.0% |
| noise | 5 | 51 | 27.1% | 24.8% | 3.4% |
| noise | 10 | 51 | 35.0% | 47.2% | 3.0% |
| spatial | 3 | 51 | 3.9% | 0.3% | 0.1% |
| spatial | 3 | 501 | 1.2% | 0.1% | 0.0% |
| spatial | 10 | 15 | 29.3% | 13.1% | 5.8% |
| spatial | 10 | 501 | 10.3% | 0.8% | 3.0% |
| faction | 3 | 501 | 1.7% | 0.9% | 0.1% |
| faction | 7 | 501 | 10.9% | 5.0% | 4.3% |
| faction | 10 | 501 | 14.8% | 7.9% | 5.1% |
(Refreshed 2026-07-26, when star_winner() was corrected to use the engine's tie-break rungs — see the caveats. Five of the ten cells moved, by 0.1–0.8pp; the cycle column is unaffected, since cycles don't depend on how STAR breaks a tie. No conclusion below changes.)
What this means
- Two completely different regimes. Under random noise, divergence is high but almost entirely cycle-driven — cycles explode with candidate count (3→8%, 10→48%), and both methods are merely resolving an electorate with no real winner. Under spatial / factional models, cycles are rare (a centrist Condorcet winner usually exists), and the divergence that occurs is the meaningful kind: the compromise CW squeezed out of the score top-two.
- More candidates → more divergence, always. With 2 candidates STAR = RR by definition; the gap widens monotonically with the field size in every model.
- Ballots cut opposite ways by model. More voters shrink divergence under spatial/factional electorates (sampling noise fades, the structure dominates → the two methods converge on the centrist), but leave it roughly flat under pure noise. So "fewer ballots → more divergence" is a property of structured electorates, not random ones.
- Factions are where the real disagreement lives. Factional/spatial models produce lower total divergence than noise, but a higher share of it is the dark-horse mechanism (CW-missed-runoff, 3–7% at 10 candidates) — polarized voters score the compromise centrist low, so RR's Condorcet winner never reaches STAR's runoff. That is the honest STAR-vs-RR philosophical disagreement (support vs. order), not a coin-flip electorate.
Caveats (read before quoting)
- Sincere, normalized 0–5 scores (each voter min-maxes their utilities). Real voters don't perfectly normalize; different scoring assumptions move the numbers.
- STAR here matches the LH engine exactly.
star_winner()implements starvote's tie-break rungs — head-to-head wins among the tied, then five-star counts, then lot (lowest column index, the engine's own fallback when a file publishes no lot numbers). It did not always: until 2026-07-26 it resolved every tie by numpy index order, which disagreed with the engine on ~2% of tie-heavy profiles and mislabelled one of the 30 dumped samples.test_sim_star_model.pynow cross-checks the model against the real engine, so that drift cannot return silently. - RR is still a model, not the engine. Copeland with a lowest-index tiebreak; LH breaks Copeland ties by margin then lot, so a knife-edge RR cell may still differ slightly from the engine.
- "Divergence" counts any different winner, including ties resolved differently — report the model, size, and mechanism split with the number.
Qualifying-round (primary method) simulation
primary_method_simulation.py measures how often a two-stage reform loses the consensus winner in its own primary — and whether the method used for the qualifying round matters.
Why this exists
Several reform packages narrow a crowded open field to the top N (usually 4) before running a good method in the general. Consensus Choice is the live example: step 1 is "an open qualifying election ... [that] determines at least four of the strongest candidates," and the published materials do not say which method that round uses.
That gap produced a genuine disagreement among people who know the field, with no published numbers on either side:
- It matters a lot — if the primary doesn't eliminate vote-splitting, the general's accuracy is capped by whatever the primary already distorted.
- It matters little — with four candidates advancing, it's unlikely the consensus candidate fails to advance even under Plurality; four slots is a lot of slack.
This script measures it instead of arguing about it.
The structural fact that makes this the whole question
If the general is a Condorcet method (Ranked Robin / Consensus Choice), a full-field Condorcet winner who advances always wins — they beat everyone head-to-head, so they beat every survivor, so they're the Condorcet winner of the surviving subset too. (This is checked as a self-test invariant, not assumed.)
So with a Condorcet general, the qualifying round is the only place the consensus winner can be lost. "How often does the primary drop the CW?" is the accuracy question — which is exactly why an unspecified primary method is not a footnote. (Run --general star and this stops holding: a CW can advance and still miss the score-based top two.)
Running it
uv run 06_Other/simulations/primary_method_simulation.py --selftest
uv run 06_Other/simulations/primary_method_simulation.py
uv run 06_Other/simulations/primary_method_simulation.py --candidates 12 --advance 3 4 5
uv run 06_Other/simulations/primary_method_simulation.py --general star
--selftest checks four invariants: a Condorcet qualifying round never drops the CW; N ≥ C advances everyone; an advanced CW always wins a Condorcet general; and a hand-built 5-ballot center squeeze is dropped by a Plurality top-2.
Results, and what they mean
Full writeup, with the measured rates, the interpretation, and the caveats: Does the qualifying round throw away the consensus winner? — kept there rather than duplicated here so the numbers have one home.
The headline, for orientation (9 candidates, 501 voters, spatial model, top-4 advancing, Ranked Robin general): a Plurality qualifying round drops the Condorcet winner 17.3% of the time; Approval drops it 0.4%; Score 0.0%; a Condorcet qualifying round 0% by construction. Four slots is real slack but not enough, the fix is nearly free, and the method matters far more than the number of slots.
Condorcet efficiency simulation
condorcet_efficiency_simulation.py — how often does each method elect the Condorcet winner? The claim "STAR's Condorcet efficiency is very high" was asserted in four places in this repo with no reproducible number behind it; this script supplies one, and the answer is more qualified than the slogan.
The definition, and the trap in it
Condorcet efficiency = P(elects the CW | a CW exists). The conditional is load-bearing. Elections with a cycle have no Condorcet winner, so no method can elect one — folding them into the denominator would drag every method down by the cycle rate and measure the electorate, not the method. Cycles are excluded and reported separately as the CW exists column, which is itself revealing: impartial culture manufactures cycles at rates (down to 63.6% CW-exists at 7 candidates) that no structured model comes close to.
Ranked Robin is the control, not a result
Copeland is Condorcet-efficient by construction, so its column must read exactly 100.0%. It is printed so a reader can check the harness: any cell below 100.0% means the pairwise code and the method code disagree, and every other number in the run is suspect. --selftest asserts it.
One STAR, not two
The script does not define its own STAR — it imports star_winner() from star_vs_rr_divergence.py, which implements the LH engine's tie-break rungs and is held to the real engine by test_sim_star_model.py. A second copy would be a second thing to drift. The finalist set used for the mechanism split comes from the same helpers, so it matches the finalists STAR really advanced (an argsort shortcut silently disagrees exactly when the score round ties for second — which is the situation the grid-loss column is about).
Running it
uv run 06_Other/simulations/condorcet_efficiency_simulation.py                  # the sweep
uv run 06_Other/simulations/condorcet_efficiency_simulation.py --selftest       # known answers
uv run 06_Other/simulations/condorcet_efficiency_simulation.py --mechanism      # why STAR misses
uv run 06_Other/simulations/condorcet_efficiency_simulation.py --chart          # the same rates, as bars
uv run 06_Other/simulations/condorcet_efficiency_simulation.py --why            # what a bigger field does
uv run 06_Other/simulations/condorcet_efficiency_simulation.py --expressiveness # ballot vs rule
uv run 06_Other/simulations/condorcet_efficiency_simulation.py --ballot-counts  # what each paper can say
uv run 06_Other/simulations/condorcet_efficiency_simulation.py --approval-cutoff 3
--expressiveness is the script's own control on its biggest caveat. The sweep hands ranked methods a strict ranking of every candidate and score methods six rungs, so part of the measured gap is the paper rather than the count. That mode varies the two independently — Copeland on a 0–5 ballot, STAR's rule at full resolution, and the ranked methods on a ballot capped at 5 or 3 ranks the way real jurisdictions cap them — and --ballot-counts gives the arithmetic half. Both back What the ballot can and cannot say, whose short version is that ~80% of STAR's gap at seven candidates is the ballot, that a capped ranked ballot is far less expressive than a 0–5 one, and that RCV-IRV cannot spend the resolution either way.
Results, and what they mean
Full writeup, with the table, the interpretation, and the caveats: Condorcet efficiency, measured — kept there rather than duplicated here so the numbers have one home.
The headlines, for orientation:
- No single number. The electorate model swings the answer by more than the gap between any two methods — RCV-IRV spans 96.7% to 47.0% across the sweep. STAR runs 74–99%.
- Under impartial culture, RCV-IRV beats STAR (96.7% vs 89.7% at 3 candidates). Printed rather than buried — but the same model produces cycles in a third of elections, so it is not one either camp should argue from.
- On a 1-D spectrum the ordering reverses and widens — at 7 candidates RCV-IRV elects the head-to-head winner less than half the time (47.0%) against STAR's 74–79%. That is center squeeze as a statistic rather than an anecdote.
- Most of STAR's shortfall is the ballot, not the rule.
--mechanismsplits the cases where the CW reached STAR's runoff and lost: about two-thirds are outright pairwise reversals on the 0–5 ballot, not ties. Rounding can never flip an individual ballot (scores are a monotone transform of utilities) but it flattens different voters at different rates, and that moves the aggregate. Score and Approval inherit the same effect.
Caveats (read before quoting)
- Sincere ballots only — no strategy anywhere in this script.
- Ballot resolution is not held constant across methods. Ranked methods get full-resolution preferences; score methods get six rungs. Realistic (a 0–5 ballot genuinely cannot rank seven candidates), but part of the STAR-vs-RR gap at large fields is ballot expressiveness, not tabulation rule. This is the biggest caveat on the whole exercise.
- Approval's column is a cutoff artifact — there is no "Approval's Condorcet efficiency" without naming the cutoff rule. Sweep
--approval-cutoff. - The CW is computed from utilities, not from any ballot — reading it off the 0–5 ballot would grade STAR against a target its own ballot had shaped, and flatter Approval the same way.
- Scores are min-max normalized per voter; that assumption is what produces the grid-loss effect above.
- Always report the model, the field size, and the voter count with the number.
Strategic CW preservation simulation
strategic_cw_preservation.py — when voters lie, does the sincere Condorcet winner still win? The script next door measures Condorcet efficiency on honest ballots; this one lets an adaptive strategic bloc attack the same electorates, and reports four numbers instead of one.
Why this exists
A recurring argument runs: a Smith-compliant method stays compliant with the ballots it was handed even after burial has rearranged the pairwise structure those ballots report, so formal compliance may not discriminate between methods once strategy is allowed — simulations show very different rules preserving the sincere Condorcet winner at similar rates. The first half is simply true, and Gibbard–Satterthwaite already guarantees no method is strategy-proof. This script exists to test the second half, and finds the convergence reproduces and then dissolves: it is an artifact of methods starting from different honest baselines, and on the metric that produces it Plurality ties Ranked Robin.
What it measures
Per method, conditioning on a unique sincere Condorcet winner: sincere (honest baseline), held (the CW still wins after the best attack), paid (an attack beat honesty for the attackers), backfired (it lost to honesty). The last two are what a single preservation rate merges.
The attack model is deliberately generous — every non-CW candidate is tried as a challenger, the bloc is every voter who sincerely prefers that challenger, and the best attack is kept. Perfect polling, perfect discipline, free coordination. The numbers are an upper bound on what strategy can achieve, not a forecast.
--smith answers a separate question: when a burial succeeds, did it eject the sincere CW from the Smith set of the cast ballots (no completion rule can help) or leave them inside it (the completion rule decides)? Ejection turns out to be the minority regime — 19–36% of successful burials — at every field size from three candidates to nine.
--objective is the experiment: utility (default) means a rational bloc submits only what beats voting honestly; displace means it unseats the CW at any cost to itself. --price runs both on the same electorates and prints the difference as a deterrent.
Controls, not results
Three cells have answers known before the code runs, and --selftest asserts all three: Ranked Robin's sincere column must read exactly 100.0%; Plurality's winner must be bit-identical before and after burial; and a bloc that shares a favourite must never elect that favourite under RCV-IRV by burying the CW (later-no-harm, made testable). Under --strategy compromise Ranked Robin holds exactly 100.0% for a fourth reason that is also a theorem — raising a challenger the bloc already preferred changes no pairwise comparison with the CW.
Running it
uv run 06_Other/simulations/strategic_cw_preservation.py
uv run 06_Other/simulations/strategic_cw_preservation.py --selftest
uv run 06_Other/simulations/strategic_cw_preservation.py --price
uv run 06_Other/simulations/strategic_cw_preservation.py --strategy compromise
uv run 06_Other/simulations/strategic_cw_preservation.py --objective displace
Caveats (read before quoting)
One bloc attacks and nobody defends, so real preservation rates are higher. Every number is conditional on the electorate model — and under impartial culture the deterrent vanishes entirely (every deterred cell reads 0.0%), which is worth knowing before quoting any strategy result computed on it. held is a hit rate and says nothing about how bad the winner is when a method misses. Full discussion: Formal compliance vs. strategic preservation.