The Equal Vote single-winner scorecard — reproduced, and checked for fairness
A widely-shared comparison from the Equal Vote Coalition scores three single-winner methods — Choose-One (Plurality), RCV-IRV, and STAR — across eight dimensions, color-coded worst→best. It is a STAR-advocacy artifact, and this library's habit is to check even our own side's materials. This page reproduces it as a table (searchable, linkable) and then assesses it row by row: what's valid, what's fair, and where it overreaches. The point isn't to discredit it — most of it holds up — but to model reading a scorecard critically. (The two starred rows are from a peer-reviewed paper — see the note at the bottom.)
→ Related: reading these fairly — the test for an honest comparison · same opinions, every method · real cases where these play out: Alaska 2022, Tennessee.
Bottom line up front. The scorecard is a good-faith, directionally accurate summary. Its structural rows — summability, exhausted ballots, tabulation, the spoiler ordering — are legitimate and match this library's own analysis. Its two weakest cells are the absolute "NO"s for STAR on spoilers and candidate-bias: STAR is far more resistant, but not immune — as STAR's own honest limits documents. And the two numeric rows come from a paper authored by STAR advocates: trust the ordering (robust across many studies), not the decimals (model-bound).
The scorecard, reproduced
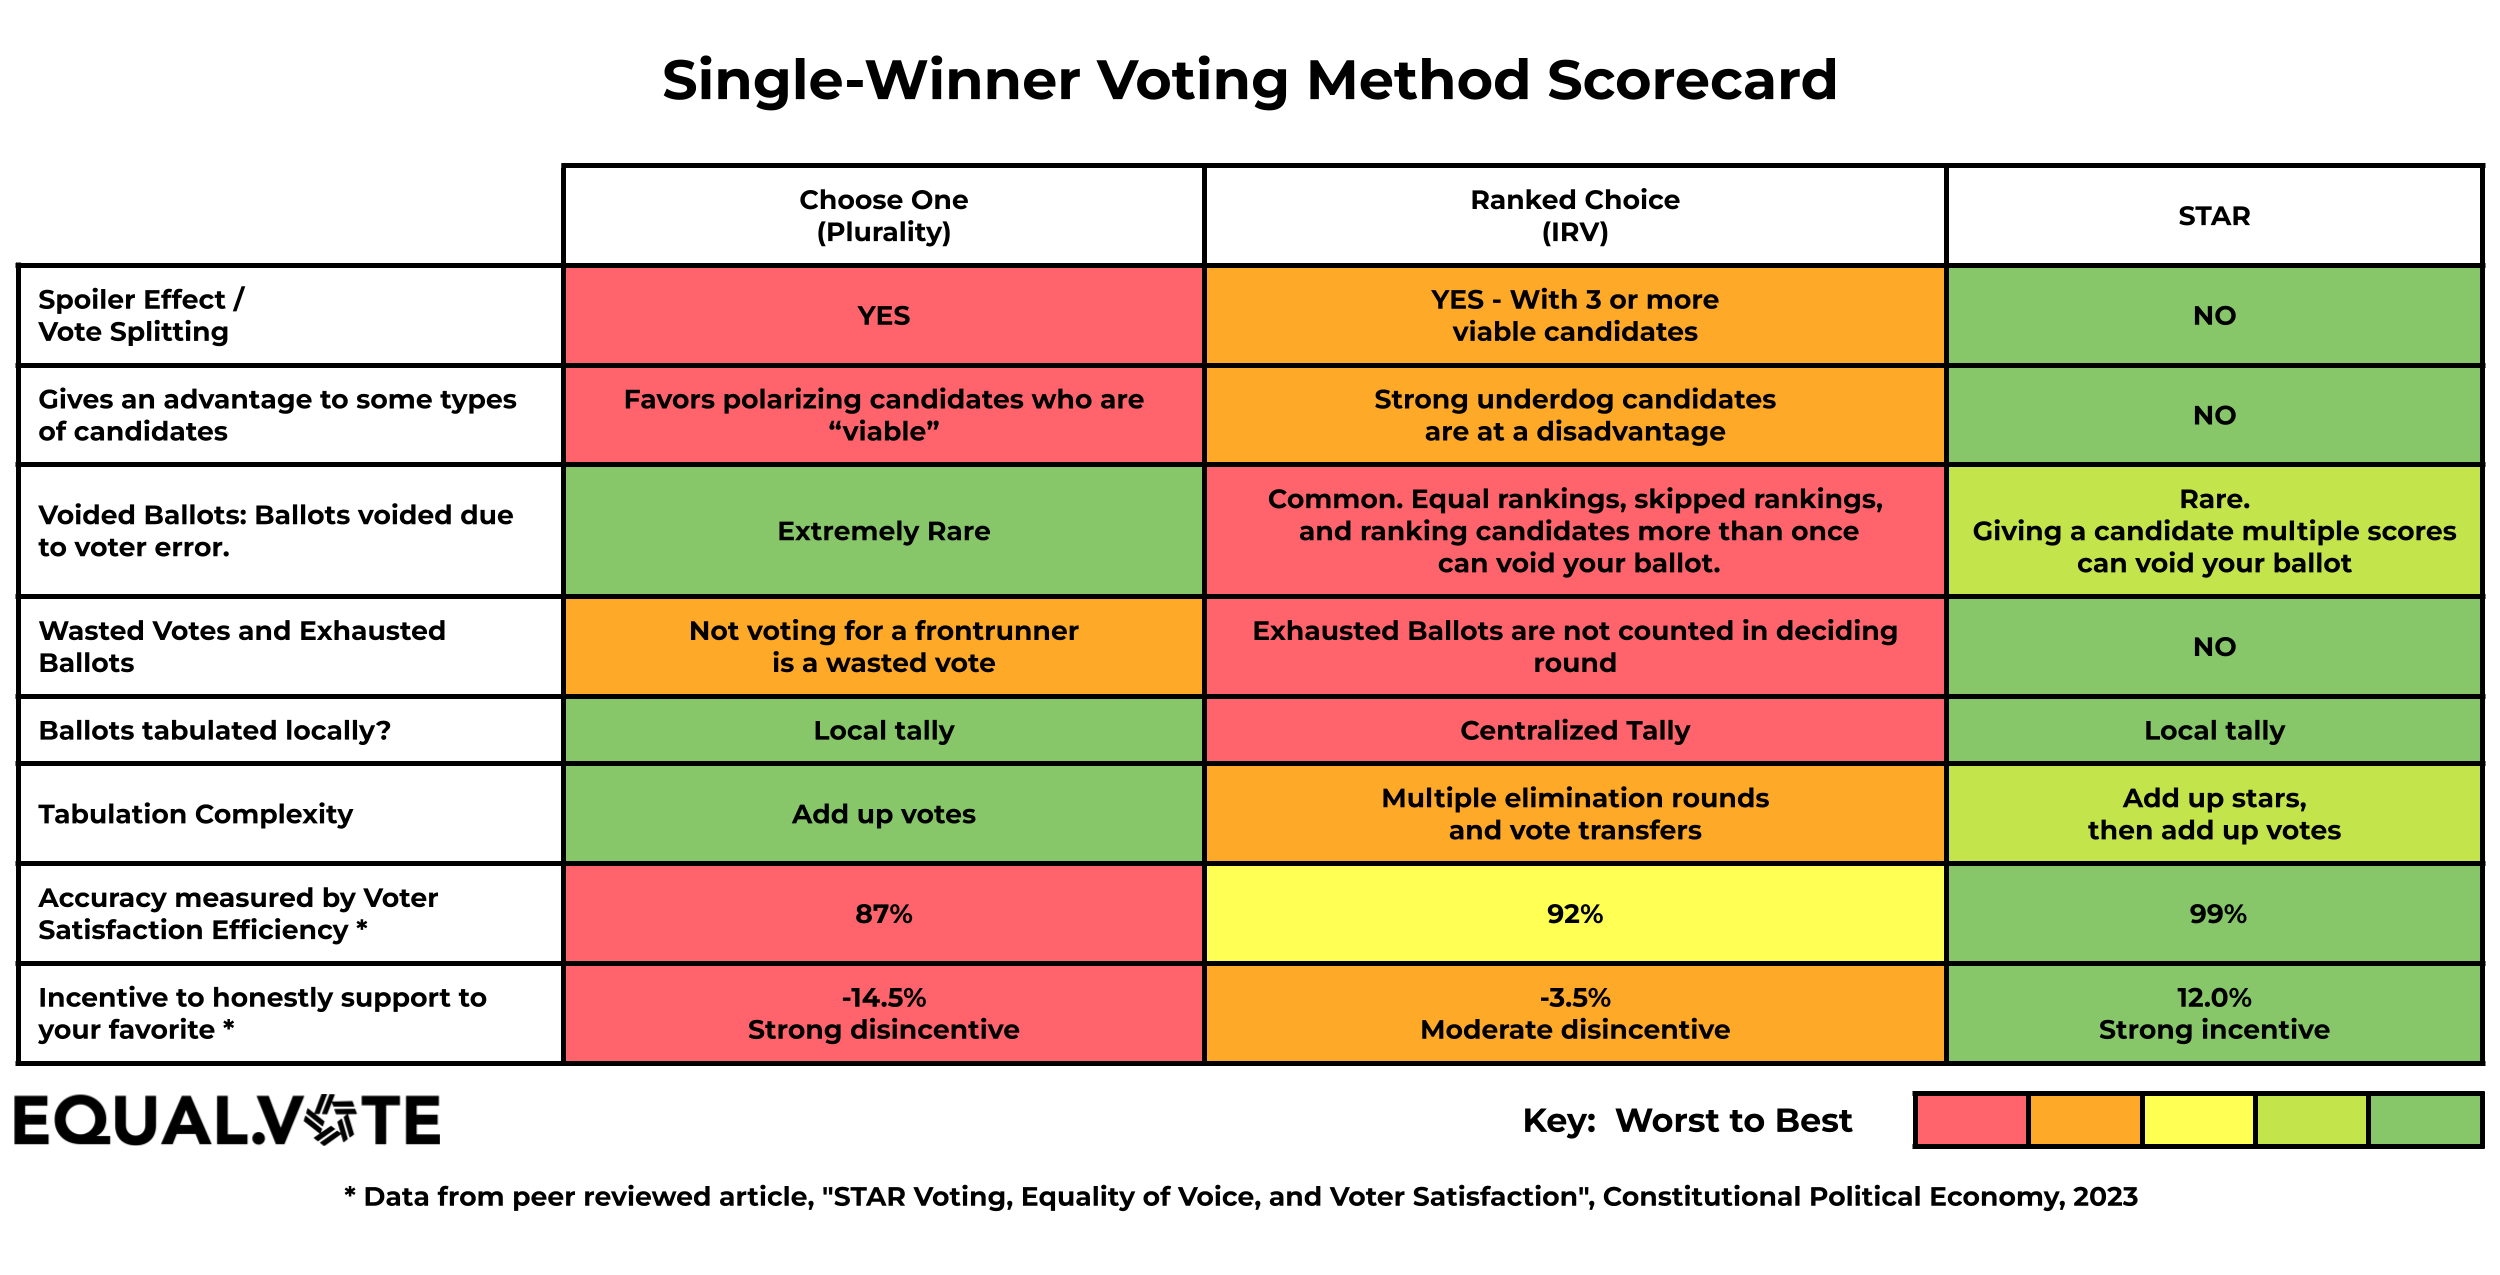
The Equal Vote Coalition's Single-Winner Voting Method Scorecard. It's reproduced as text below so every claim is searchable and checkable.
Rating key (worst → best): 🟥 · 🟧 · 🟨 · 🟢 good · 🟩 best.
| Dimension | Choose-One (Plurality) | Ranked Choice (RCV-IRV) | STAR |
|---|---|---|---|
| Spoiler effect / vote splitting | 🟥 Yes | 🟧 Yes — with 3+ viable candidates | 🟩 No |
| Advantages some candidate types | 🟥 Favors polarizing "viable" candidates | 🟧 Strong underdog candidates disadvantaged | 🟩 No |
| Voided ballots (voter error) | 🟩 Extremely rare | 🟥 Common — equal/skipped rankings or ranking a candidate twice can void | 🟢 Rare — giving one candidate multiple scores can void |
| Wasted / exhausted ballots | 🟧 Not voting for a frontrunner is a wasted vote | 🟥 Exhausted ballots aren't counted in the deciding round | 🟩 No |
| Ballots tabulated locally? | 🟩 Local tally | 🟥 Centralized tally | 🟩 Local tally |
| Tabulation complexity | 🟩 Add up votes | 🟧 Multiple elimination rounds + vote transfers | 🟢 Add stars, then add up votes |
| Accuracy — Voter Satisfaction Efficiency * | 🟥 87% | 🟨 92% | 🟩 99% |
| Incentive to honestly support your favorite * | 🟥 −14.5% (strong disincentive) | 🟧 −3.5% (moderate disincentive) | 🟩 +12.0% (strong incentive) |
The assessment, row by row
Verdict tags: ✅ fair · ⚠️ fair but loaded · ❗ overclaim.
-
Spoiler / vote splitting — ❗ (STAR cell overclaims). Plurality "Yes" is textbook-correct — it's the method most prone to vote-splitting and spoilers. "Yes, with 3+ viable" for RCV-IRV is fair: IRV reduces spoilers but the center squeeze is a real one. But STAR "No" is too strong. STAR is not spoiler-proof — in a genuine Condorcet cycle its runoff is IIA-sensitive, and a candidate who can't win can flip the result by changing which two reach the runoff — worked, BV-backed, on sincere ballots (the cycle spoiler, BV2212). Honest wording: "greatly reduced, not eliminated."
-
Advantages some candidate types — ❗ (STAR cell overclaims). Plurality favoring polarizing front-runners, and IRV disadvantaging the broadly-liked center (again the squeeze), are both accurate. STAR "No" glosses over a real lean: STAR systematically favors broadly-supported, consensus candidates over ones with an intense but narrow base — that's the point of the scoring-round-plus-runoff design, and it's a bias, just a defensible one. Every method advantages some type; the honest claim is "favors consensus candidates," not "none."
-
Voided ballots — ⚠️ (fair, one loaded word). Directionally solid and, to its credit, self-critical: STAR gets the good band, not the best, because over-scoring a candidate can void a STAR ballot too. Ranked ballots really do spoil more often (roughly 0–2% rated vs. 4–9% ranked). "Common" for IRV is the loaded word — spoilage is higher, but whether an equal/skipped ranking voids the ballot is implementation-dependent (many jurisdictions interpret voter intent or simply exhaust the ballot rather than void it).
-
Wasted / exhausted ballots — ✅ (fair). Exhausted ballots — ballots whose ranked candidates are all eliminated before the final round — are a genuine IRV phenomenon. STAR "No" is defensible: every ballot is read in both rounds, and a ballot that's neutral in the runoff is Equal Support by the voter's own scoring, not discarded by the method.
-
Ballots tabulated locally? — ✅ (fair, and the strongest row). This is summability, and it's IRV's most legitimate structural weakness: precinct subtotals add up under Plurality and STAR, but IRV's eliminations need every ballot in one place, so it can't be verified precinct-by-precinct. Worked, three methods, one example. Nothing loaded here — this is just true.
-
Tabulation complexity — ✅ (fair). Accurate, and again honestly self-scored: STAR gets good, not best, because it's two steps (add scores, then one runoff comparison) — genuinely simpler than IRV's rounds-and-transfers, but a hair more than Plurality's single sum.
-
Accuracy (VSE) — ⚠️ (direction robust, precision oversold, disclose the lean). Voter Satisfaction Efficiency is a real, respected simulation yardstick, and the ordering Plurality < IRV < STAR is robust across many independent studies. But the exact numbers (87/92/99) are specific to one model's assumptions about voters, candidates, and strategy — IRV's VSE in particular swings a lot between studies — so single-decimal precision claims more than simulation can deliver. Read them as "under this model," not as constants. The peer-reviewed source is Wolk, Quinn & Ogren (2023) — claim-checked there, including the point that on its own data a Condorcet method (Smith/Minimax) ties STAR on VSE and beats it on strategy-resistance.
-
Honesty incentive — ⚠️ (same caveats). The −14.5 / −3.5 / +12.0 figures are the favorite-betrayal pressure from the same 2023 paper. The ranking is theory-consistent: Plurality punishes honesty hardest, IRV moderately, STAR least. But "STAR = a positive incentive" shouldn't be read as a guarantee — STAR is not favorite-betrayal-proof; it fails the criterion in rare constructions (STAR's honest limits). It's a modeled average, not a promise.
So — valid? fair?
- Valid: yes, directionally. Every row points the right way, and the structural rows (5, 6, and the exhausted-ballot/summability facts) are simply correct and are among the best-grounded criticisms of IRV there are.
- Fair: mostly — with two exceptions and one disclosure. The absolute "NO" cells (rows 1–2) are the overclaims: they turn "much more resistant" into "immune," which our own honest-limits page won't support. And the numeric rows (7–8) come from Wolk, Quinn & Ogren (2023) — all Equal Vote / STAR-affiliated. That doesn't make the numbers wrong (Quinn's VSE holds up when you check it), but per this library's sourcing rule the lean should be disclosed, not hidden — cite the ordering, not the decimals.
- The RCV-IRV column deserves a word in its defense: the coloring runs a touch harsher than a neutral referee might assign. IRV's real-world track record is mostly uneventful; its genuine failures (center squeeze, summability, exhaustion) are real but rarer than a wall of red/orange implies. This library's own rule is to state the rarity and apply the test symmetrically — a scorecard that scores a method only on its bad days isn't lying, but it isn't the whole story either.
Net: a useful, good-faith summary that a reader can trust for direction. A careful reader should mentally soften the two "NO"s to "greatly reduced," and read the percentages as "under this model." That's not a knock on STAR — STAR's honest case is strong enough that it doesn't need the absolutes.
Beyond the three — where Ranked Robin and 3-2-1 would land
Equal Vote's card compares only Plurality, RCV-IRV, and STAR. For a fuller picture, here's where two other good rated/ranked methods sit on the same qualitative dimensions — Ranked Robin (Condorcet) and 3-2-1 (Quinn's Good/OK/Bad method). (Our extension, not EVC's — and we leave the numeric VSE / honesty-incentive rows blank rather than invent figures the original card didn't measure for these two.)
| Dimension | Ranked Robin | 3-2-1 |
|---|---|---|
| Spoiler / vote-splitting | 🟩 No | 🟩 No |
| Advantages some candidate types | 🟩 No — elects the consensus/Condorcet winner | 🟩 No |
| Voided ballots | 🟢 Rare — equal ranks allowed (no overvote trap) | 🟢 Rare — only three levels to mark |
| Wasted / exhausted ballots | 🟩 No — reads every rank | 🟩 No |
| Ballots tabulated locally? | 🟩 Local — pairwise matrix is summable | 🟩 Local — Good/Bad tallies + pairwise matrix |
| Tabulation complexity | 🟧 Build the pairwise grid, count wins | 🟧 Three steps + the clone/dark-horse guards |
| VSE / honesty incentive | high (Condorcet-efficient); not on EVC's card | high (STAR-like); not on EVC's card |
Both clear the bar the scorecard is really drawing — summable, center-squeeze-free, no wasted votes, honesty-friendly — which is the company STAR keeps. Where they differ from STAR is the fine detail the strategic-pathologies scorecard lays out (RR's sincere dark-horse seam; 3-2-1's coarser 3-level ballot). The headline: the real divide isn't STAR-vs-these — it's all four (STAR, RR, 3-2-1, Approval) versus Plurality and IRV.
The longer version — Equal Vote's prose pros/cons, and its sources
The scorecard is the graphic; Equal Vote's STAR vs RCV pros & cons is the prose expansion — same lean, more detail, and, to its credit, actual citations. That makes it checkable. Here is what's behind the headline numbers, and where the citation is stronger than the study it rests on:
| The EVC claim | The real source | The honest reading |
|---|---|---|
| "≈1 in 5" close 3-candidate contests go wrong | Ornstein & Norman, Public Choice 2014 | The paper measures monotonicity failure, not spoilers — ≥15% of competitive 3-way IRV races, rising toward 50% only in near-ties (Miller, "Closeness matters," 2017). Real, but a specific pathology concentrated in close elections — not "1 in 5 elections come out wrong." |
| RCV ballots "~10× more likely to be rejected" | Pettigrew & Radley, Political Behavior 2025 (3M+ ballots) | True as a ratio — but the absolute rate is 0.53% vs 0.04%, both under 1%. The load-bearing finding is the demographic disparity (more errors where there are more racial-minority, lower-income, lower-education voters). Peer-reviewed — and contested (a Mathematics & Democracy Institute rebuttal disputes the methodology). |
| Ballot exhaustion "9.6%–27.1%" | Burnett & Kogan, Electoral Studies 2015 | Solid; exhaustion is real and varies widely by race. |
| San Francisco RCV spoilage + racial gaps | Neely & McDaniel (SF State) | Real; the equity angle is the substantive point, and it cuts against RCV's own fairness case. |
| "Most accurate" / VSE | Quinn's VSE simulations | Ordering robust; exact % model-bound — same caveat as scorecard row 7. |
Two more fairness notes on the prose page, beyond the graphic's:
- It states STAR "does not incentivize strategic voting." Too strong. STAR reduces the incentive (and scores well on it in simulation), but no deterministic method is strategy-proof (Gibbard–Satterthwaite) and STAR has its own strategic edge cases. "The least strategically vulnerable of the three" is the defensible version.
- A framing asymmetry the page's own structure shows: STAR's newness / no governmental use yet is filed as a minor con, while RCV's long track record is turned against it (every real failure catalogued). A neutral reader should weight "untested at scale" as a genuine STAR unknown, symmetrically.
The pattern holds across Equal Vote's materials: the facts are mostly right and well-sourced, the framing is advocacy. Cite the sources — they're good and worth reading — keep the ordering, and discount the absolutes and the relative-risk drama.
Source: Single-Winner Voting Method Scorecard, Equal Vote Coalition (img/eqv_single_winner_scorecard.png). Starred rows (VSE; honesty incentive): Sara Wolk, Jameson Quinn & Marcus Ogren, "STAR Voting, Equality of Voice, and Voter Satisfaction," Constitutional Political Economy (2023). The graphic's content is reproduced as text above so the claims are searchable and checkable.