BV2264 — NaN% in the runoff table when nobody prefers either finalist
Baseline capture — recorded before any fix. Everything under Actual result is what BetterVoting does today (2026-08-02, production). The point of this page is to make the fix verifiable: when the change lands, re-run these steps and the Expected after the fix section is the assertion.
Sheet row still needed.
BV2264was allocated from the block after the highest id observed across the repos (BV2262) — it is not yet a row in the test-case sheet. Paste-ready:BV2263-2267-sheet-rows.tsv. If it collides with an existing row, renumber here.
Purpose
Reproduce the NaN% of #1035 from a plain election, and pin down which surfaces it actually appears on. The condition is not a scoring-round tie — it is the runoff denominator being zero.
Master data
| Election | 3d8qdr · results |
| Method | STAR |
| Voter access | open (anyone with the link) |
| Public results | on |
Ballots
Ann  Ben  Cal
  5    5    0
  5    5    0
  5    5    0
Steps
- Open the results page. Note the header voter count.
- Expand Race Details and read the Runoff Table.
- Switch the Automatic Runoff Round widget from bar to pie view.
Actual result — today
Header reads 3 voters — no ballot is an abstention here, so all three are counted.
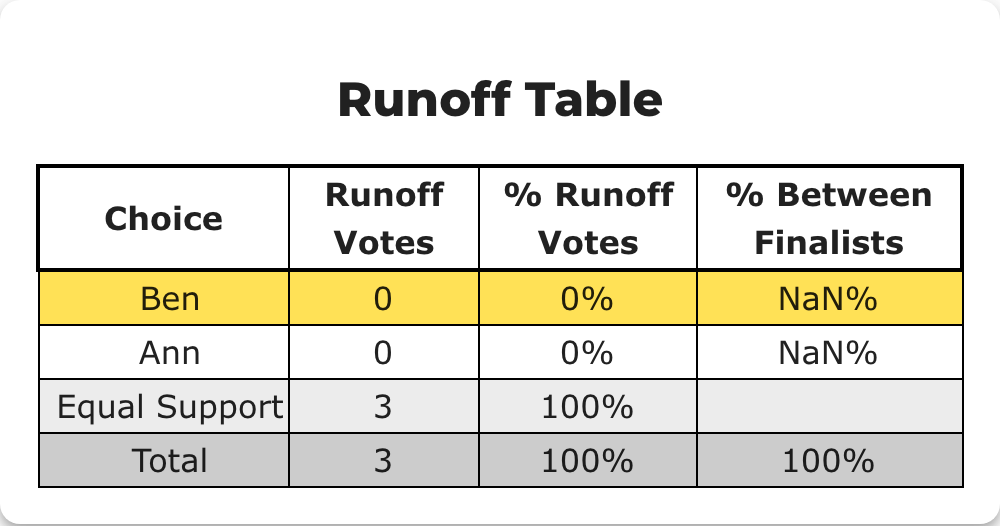
Runoff table — NaN% in "% Between Finalists":
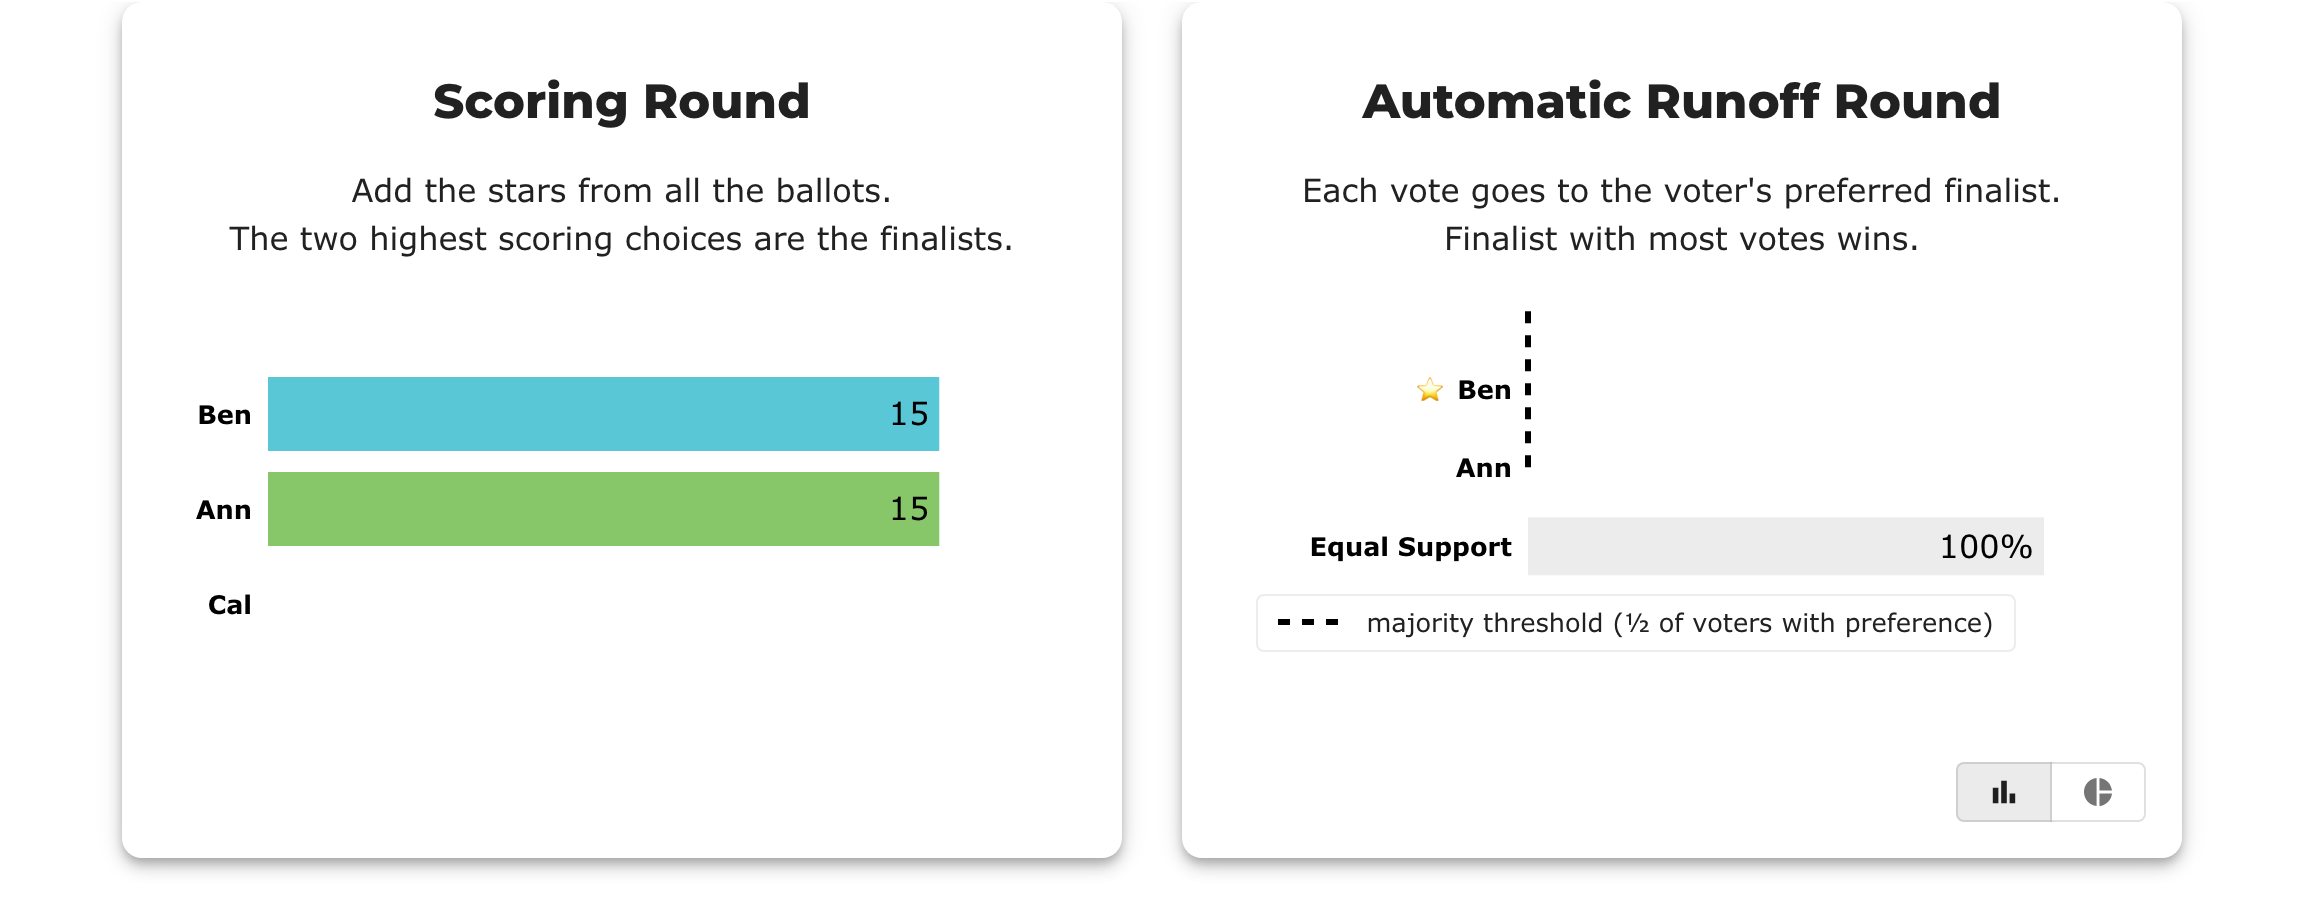
Bar view — both finalists at 0, Equal Support 100%, majority marker pinned at 0:
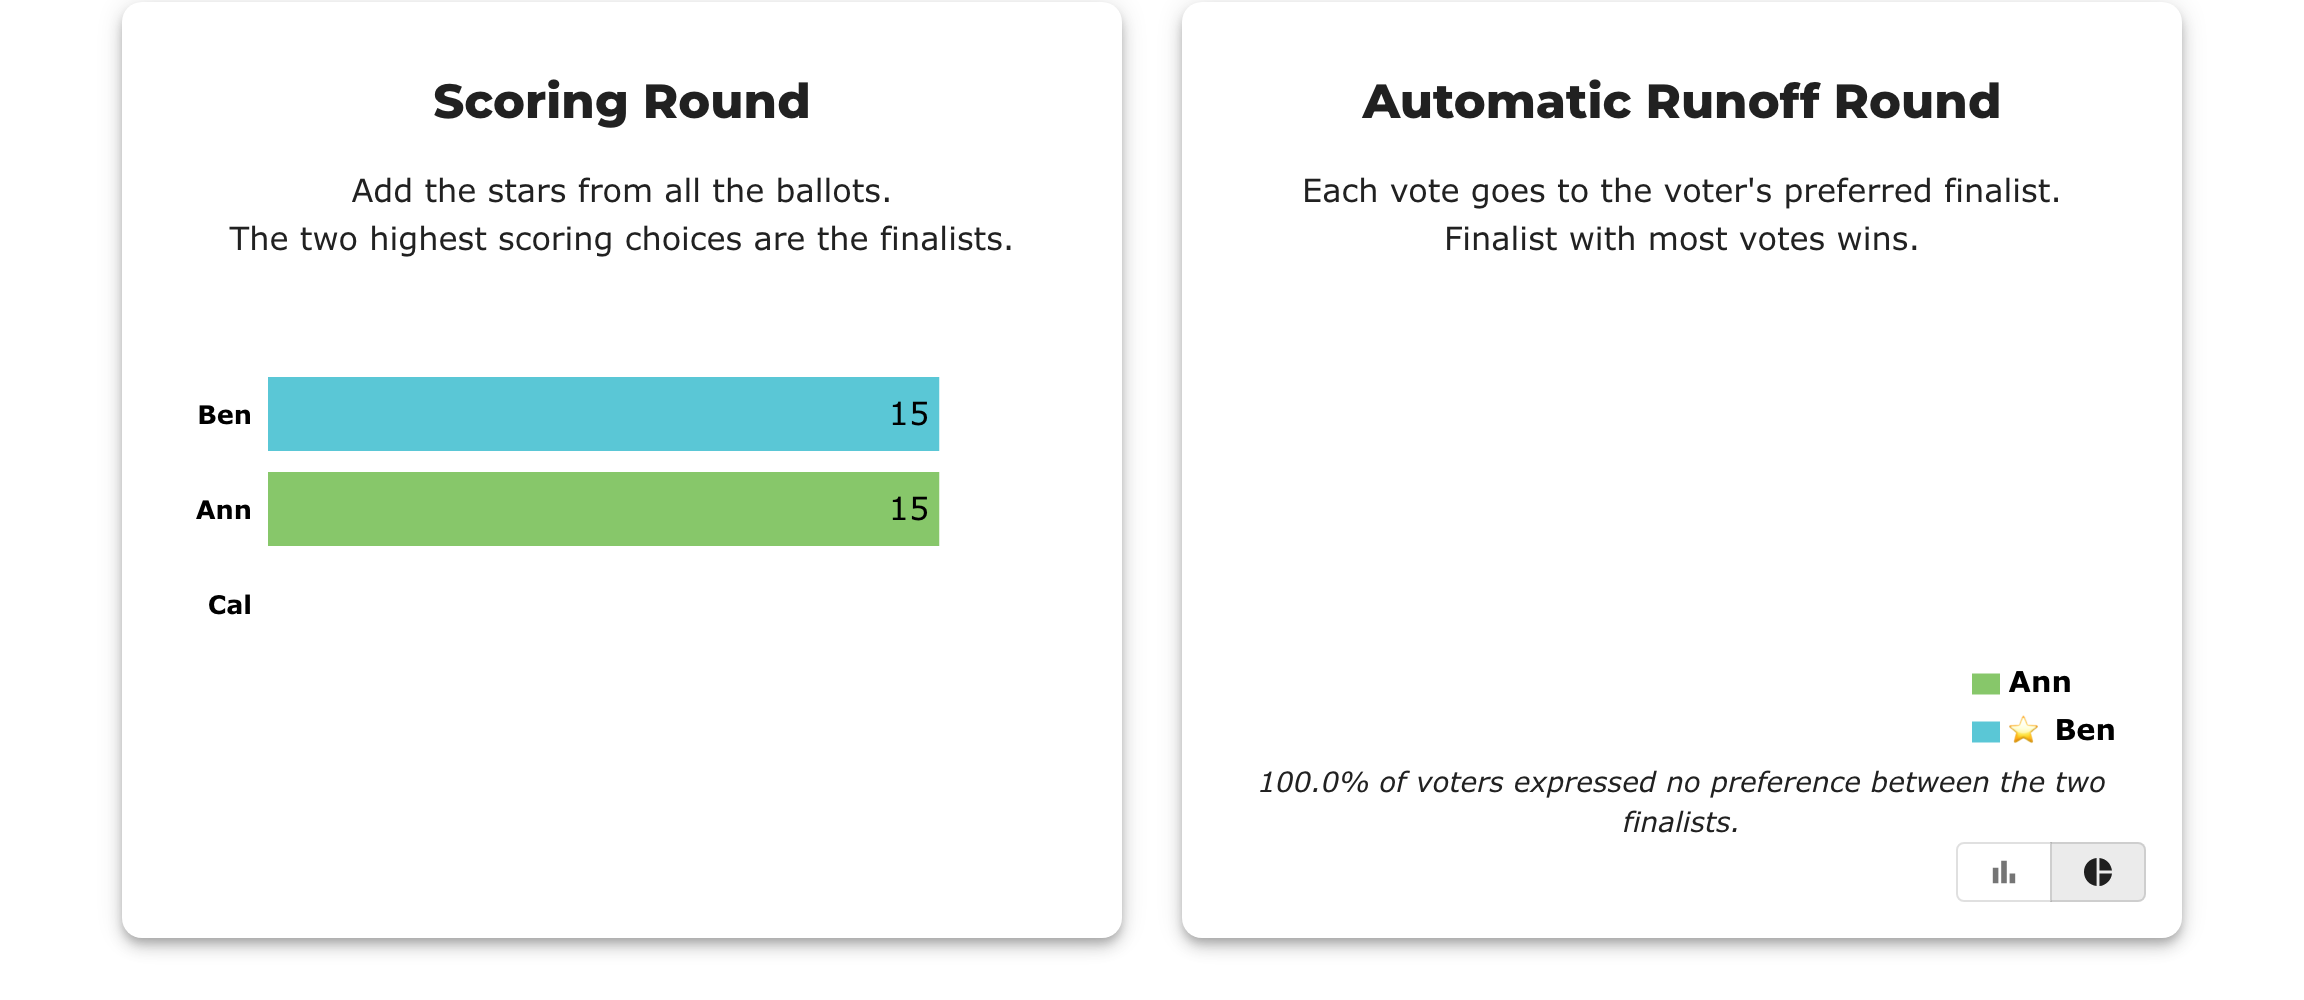
Pie view — renders completely empty, with only a legend and the footnote:
What is wrong
Ann and Ben are each preferred over the other zero times, so finalistVotes = 0 and runoffVotes / finalistVotes is 0/0. The table prints NaN%.
Correction worth recording: the pie chart does not print NaN%. Recharts draws no sectors when every value is 0, so the label callback never runs and the chart is simply blank. An earlier prediction in this repo said both surfaces show NaN — only the table does. The pie has a different defect: an unexplained empty chart.
Expected after the fix
The runoff table shows a dash, n/a, or a short explanatory row rather than NaN% — the honest statement is that no voter expressed a preference between the finalists, which is a real outcome and more informative than 0%.
The pie view says the same in words instead of rendering an empty circle.
Related
#1035 · comment posted · issues/1035-nan-root-cause-comment-posted.md